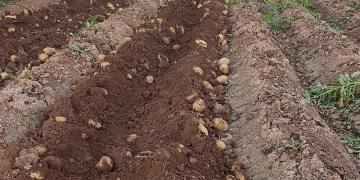
Argentina: Potatoes permanently in "red" among regional productions
Regional Economies Traffic Light: Activities in red increase, and cotton’s situation worsens. During September 2025, the Regional Economies Traffic Light recorded 5 activities in green, 8 in yellow, and 6 in red.

The indicator analyzes three components: business, production, and market. The first evaluates the evolution of price and cost, both monthly and year-on-year. The second measures the area or stock, as applicable, and production. And the last measures the evolution of exports and imports of production, as well as domestic consumption.
The activities highlighted in red are: yerba mate, rice, potatoes, wine and grape must, vegetables, and, starting this month, cotton. The main cause is the deterioration of the business component: in most of these sectors, the prices received by producers have lagged behind inflation and increased costs, seriously affecting profitability.
In the case of cotton, the downturn is due to a combination of factors: producer prices grew by only 10% year-on-year, well below inflation; production in the previous season fell by 15%, while a larger planted area is projected for 2025/26. Furthermore, foreign trade exacerbated the deterioration: exports decreased by 12% in the last twelve months and imports grew by 119%, reducing competitiveness and pushing the sector into the red.
The activities highlighted in green include cattle, swine, poultry, sheep, and grains. In these sectors, the business component shows sustained improvement, as prices have risen above inflation. This is complemented by favorable performance in the production and market components. The remaining eight activities are highlighted in yellow: forestry, honey, peanuts, milk, tobacco, sweet citrus fruits, cassava, and pears and apples. These sectors show neither significant improvements nor declines in the three components evaluated.
The case of pears and apples stands out due to its decline. Despite maintaining high production volumes and a dynamic foreign trade, they began to show signs of deteriorating profitability. The price paid to producers fell 10% month-on-month and only increased 2% year-on-year, well below inflation. Although production grew and exports increased by 51%, the drop in real income and the increase in imports weaken the business component, which explains its decline from green to yellow.
Foreign trade of regional economies
Analyzing the international landscape reveals how regional economies are integrated into global trade and which sectors account for foreign exchange earnings and expenditures. A review of accumulated foreign trade between January and September 2025 shows a structure heavily concentrated in certain primary sectors, where a few industries account for the majority of exports and imports.
Between January and September 2025, the 19 agricultural and livestock production activities and regional economies surveyed in this report registered exports of USD 43.3 billion, representing a 60% increase compared to the same period and the historical average of the last 10 years (USD 27 billion). The export structure shows a high degree of concentration: 77% of revenue came from grain complexes (soybeans, corn, wheat, sunflower, barley, and sorghum), while 9% corresponded to the beef sector. The remaining 15%, equivalent to approximately USD 4 billion, was contributed by all other regional economies.
During the same period, total imports averaged USD 2.3 billion. Of this amount, 73% was linked to external purchases of grain products, followed by forestry at 9%, pork at 4%, and cotton at 3%. The remaining 11% was distributed among other sectors with less impact.
The associated graphs show the composition of foreign trade, differentiating exports and imports, excluding the grain complex to facilitate the visualization of the relative weight of the rest of the activities.
Fuente: Coninagro